PHPSimplex
Optimizing resources with Linear Programming
Example (part 2): Graphical method
Solve using the Graphical method the following problem:
| Maximize | Z = f(x,y) = 3x + 2y |
| subject to: | 2x + y ≤ 18 |
| 2x + 3y ≤ 42 | |
| 3x + y ≤ 24 | |
| x ≥ 0 , y ≥ 0 |
- Initially the coordinate system is drawn and each variable is associated to an axis (generally 'x' is associated to the horizontal axis and 'y' to the vertical one), as shown in figure 1.
- A numerical scale is marked in axis, appropriate to the values that variables can take according to the problem constraints. In order to do this, for each variable corresponding to an axis, all variables are set to zero except the variable associated to the studied axis in each constraint.
- The following step is to represent the restrictions. Beginning with the first, the line obtained by considering the constraint as an equality is drawn. In the example, this line is the segment connecting A and B points, and the region delimiting this restriction is indicated by the color YELLOW. This process is repeated with the other restrictions, BLUE and RED regions correspond to the second and third constraint respectively.
- The feasible region is the intersection of the regions defined by the set of constraints and the coordinate axis (conditions of non-negativity of variables). This feasible region is represented by the O-F-H-G-C polygon in PURPLE color.
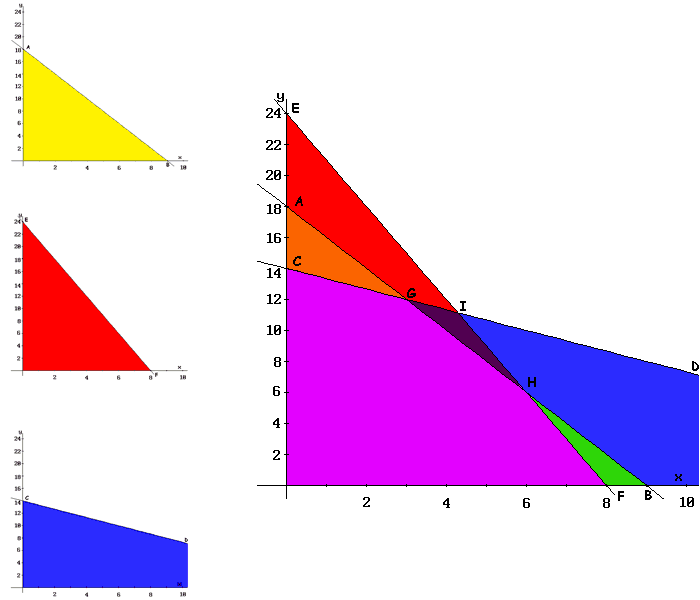
- As a feasible region exists, extreme values (or polygon vertices) are calculated. These vertices are the points candidate as optimal solutions. In the example, these points are O, F, H, G, and C, as shown in the figure.
- Finally, the objective function (3x + 2y) is evaluated in each of these points (results are shown in the tableau below). Since G-point provides the greatest value to the Z-function and the objective is to maximize, this point is the optimal solution: Z = 33 with x = 3 and y = 12.
| Extreme point | Coordinates (x,y) | Objective value (Z) |
|---|---|---|
| O | (0,0) | 0 |
| C | (0,14) | 28 |
| G | (3,12) | 33 |
| H | (6,6) | 30 |
| F | (8,0) | 24 |
Graphical method and Simplex method comparison
Successive constructed tableaux in the Simplex method will provide the value of the objective function at the vertices of the feasible region, adjusting simultaneously, the coefficients of initial and slack variables.
In the initial tableau the value of the objective function at the O-vertex is calculated, the coordinates (0,0) correspond to the value which have the basic variables, being the result 0.
| Tableau I . 1st iteration. | |||||||
|---|---|---|---|---|---|---|---|
| 3 | 2 | 0 | 0 | 0 | |||
| Base | Cb | P0 | P1 | P2 | P3 | P4 | P5 |
| P3 | 0 | 18 | 2 | 1 | 1 | 0 | 0 |
| P4 | 0 | 42 | 2 | 3 | 0 | 1 | 0 |
| P5 | 0 | 24 | 3 | 1 | 0 | 0 | 1 |
| Z | 0 | -3 | -2 | 0 | 0 | 0 | |
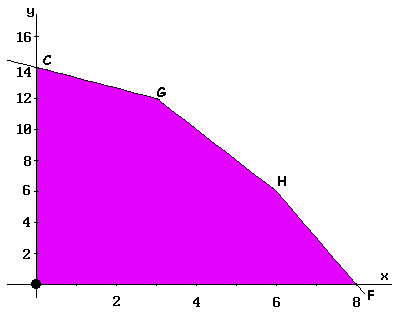
The input base variable in the Simplex method determines towards what new vertex is performed the displacement. In this example, as P1 (corresponding to 'x') enters, the displacement is carried out by the OF-edge to reach the F-vertex, where the Z-function value is calculated. This step occurs in the second iteration of the Simplex method, as shown in tableau II. The corresponding value to F-vertex is calculated in it, and Z = 24 is the obtained value for the function.
| Tableau II . 2nd iteration. | |||||||
|---|---|---|---|---|---|---|---|
| 3 | 2 | 0 | 0 | 0 | |||
| Base | Cb | P0 | P1 | P2 | P3 | P4 | P5 |
| P3 | 0 | 2 | 0 | 1/3 | 1 | 0 | -2/3 |
| P4 | 0 | 26 | 0 | 7/3 | 0 | 1 | -2/3 |
| P1 | 3 | 8 | 1 | 1/3 | 0 | 0 | 1/3 |
| Z | 24 | 0 | -1 | 0 | 0 | 1 | |
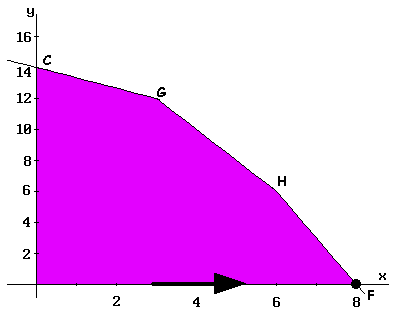
A new displacement by the FH-edge is made, up to H-vertex (data in Table III). In the third iteration, the value of the function at the H-vertex is calculated to obtain Z = 30.
| Tableau III . 3rd iteration. | |||||||
|---|---|---|---|---|---|---|---|
| 3 | 2 | 0 | 0 | 0 | |||
| Base | Cb | P0 | P1 | P2 | P3 | P4 | P5 |
| P2 | 2 | 6 | 0 | 1 | 3 | 0 | -2 |
| P4 | 0 | 12 | 0 | 0 | -7 | 1 | 4 |
| P1 | 3 | 6 | 1 | 0 | -1 | 0 | 1 |
| Z | 30 | 0 | 0 | 3 | 0 | -1 | |
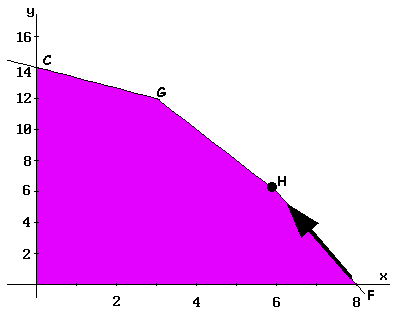
The process goes on through the HG-edge up to G-vertex, obtained data are shown in tableau IV. At this point, the process ends, being able to check that the solution does not improve moving along GC-edge up to C-vertex (the current value of the Z-function is not increased).
| Tableau IV . 4th iteration. | |||||||
|---|---|---|---|---|---|---|---|
| 3 | 2 | 0 | 0 | 0 | |||
| Base | Cb | P0 | P1 | P2 | P3 | P4 | P5 |
| P2 | 2 | 12 | 0 | 1 | -1/2 | 1/2 | 0 |
| P5 | 0 | 3 | 0 | 0 | -7/4 | 1/4 | 1 |
| P1 | 3 | 3 | 1 | 0 | 3/4 | -1/4 | 0 |
| Z | 33 | 0 | 0 | 5/4 | 1/4 | 0 | |
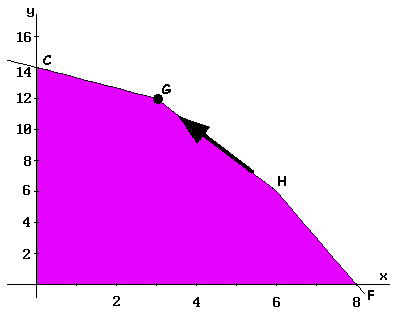
The maximum value of the objective function is 33, and it corresponds to the values x = 3 and y = 12 (G-vertex coordinates).
In Graphical method is necessary to calculate the value of the objective function at each vertex of feasible region, while the Simplex method ends when the optimum value is found.